
Free Fishbone (Ishikawa) Diagram Template
Start from a filled-in customer experience example, then map your own problem on the blank diagram. Six CX bones, an evidence column for every cause, and a tracker for what you verify.
What is in the Excel pack
- Filled-in example first: VIP NPS drop, causes on all six bones
- Blank fishbone diagram plus a cause and evidence table
- Root cause and action tracker: owner, due date, metric
- Session checklist: before, during and after the workshop
- How-to sheet with the rules that keep it honest
Example: VIP customer NPS dropped from 58 to 44
This is page 1 of the template. Page 2 is the same diagram, blank.
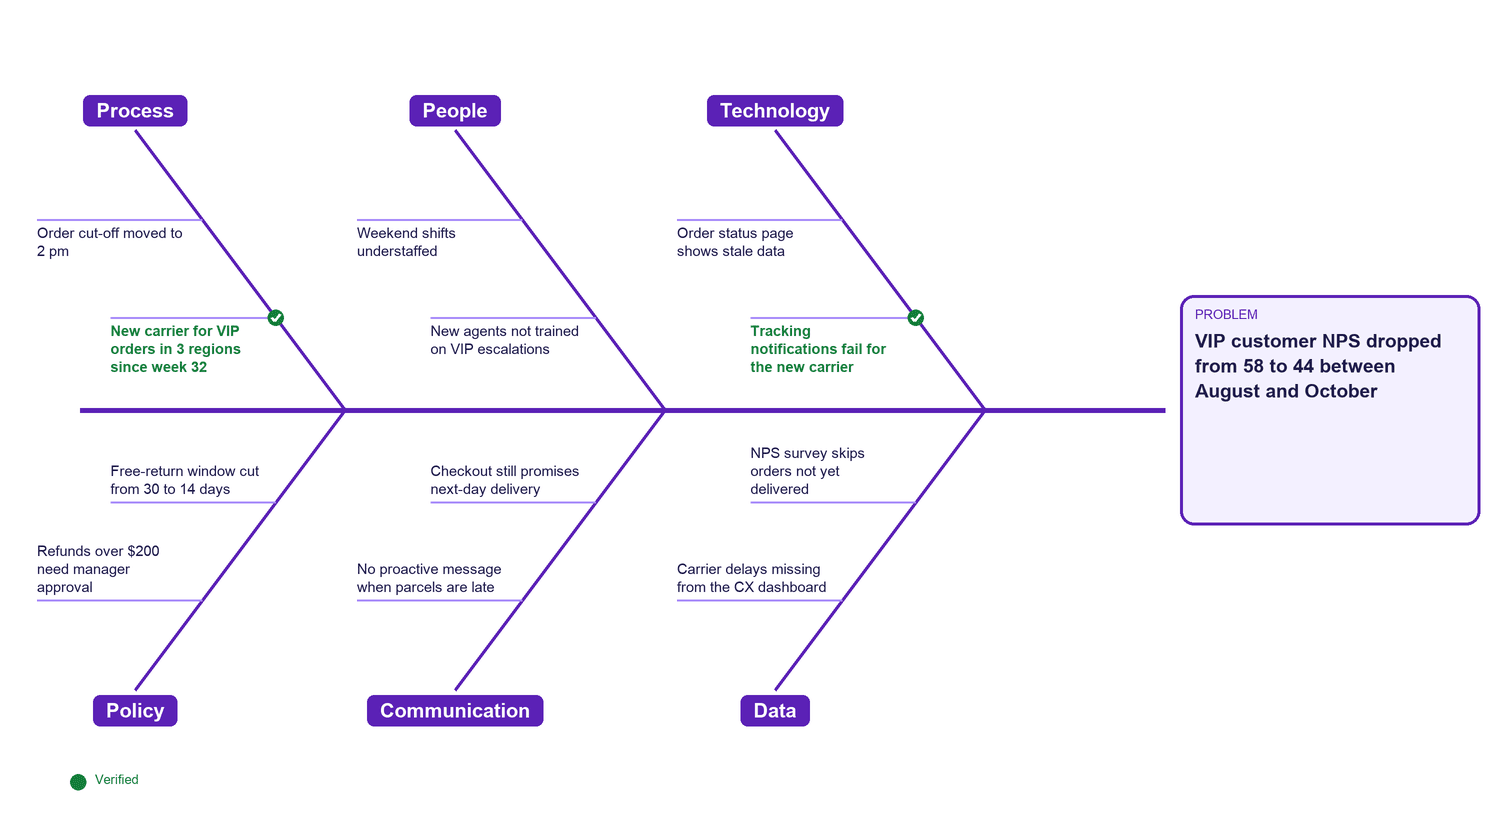
| Bone | Candidate causes |
|---|---|
| Process |
|
| People |
|
| Technology |
|
| Policy |
|
| Communication |
|
| Data |
|
| Root cause (verified) | The new carrier misses the VIP delivery promise and its tracking updates never reach customers. |
| Action | Escalate the carrier SLA, fix carrier notifications, contact affected VIP customers. |
How to run a fishbone analysis
- 1Write the problem at the head as a fact: what, where, since when, how much.
- 2Invite the teams that touch the journey: support, operations, product, logistics.
- 3Go bone by bone (Process, People, Technology, Policy, Communication, Data) and list every candidate cause.
- 4Mark the likely ones: causes that changed when the problem started or show up on several bones.
- 5Verify each likely cause with data before acting. A fishbone produces hypotheses, not conclusions.
- 6Run a 5 Whys on each verified cause to reach the root, then track the action.
Frequently asked questions
What are the six bones of a customer experience fishbone?
Process, People, Technology, Policy, Communication and Data. They adapt the manufacturing 6M categories to customer journeys.
Is the fishbone template free?
Yes. The printable PDF downloads without an email. The Excel pack, with the cause table, root cause tracker and checklist, is sent to your email for free.
Fishbone or 5 Whys: which should I use?
Both, in that order. The fishbone lists possible causes across the whole journey; the 5 Whys then digs into each verified cause until it reaches the root.
When is a fishbone not enough?
When the problem shows up across thousands of tickets, reviews or survey comments. A workshop lists hypotheses from memory; Pivony analyses all of the feedback and shows which causes the data supports.
Have thousands of complaints, reviews or tickets?
Pivony finds and verifies root causes across all of your customer feedback, not a workshop sample.
Get a free root cause audit